Unlock the power of Google Analytics 4.
July 1, 2023 marks the date Universal Analytics (UA) stops processing new data; so there’s been no better reason to migrate over to Google Analytics 4.
The good news, however, is GA4 opens a whole new world of reporting!
In this handy guide, our SEO expert James King will talk you through the necessary steps to take to ensure you’re maximizing all reporting capabilities GA4 has to offer.
GA4 Data Retention
If you already have GA4 set up, this short guide will take you through how to retain your data. Setting up your data retention in GA4 is an essential step for any business that wants to collect and analyse its customer data.
GA4 offers enhanced data collection when compared to its predecessor. You can expect better insights into the following:
- User behaviours
- Engagement
- Conversions
Setting Up Data Retention in GA4
If you want to collect and analyze your website data, you need to set up user and event data retention. The default setting for this in GA4 is set at 2 months, so any data older than this will be deleted. If you’re planning yearly reports, you should change this to the longest time frame available, which is 14 months.
You can do this in these simple steps:
- Log in to your GA4 account
- Select the Admin panel on the left-hand side of the screen
- Select Property > Data Settings > Data Retention > Event Data Retention > 14 months > Save
- Hooray! Your data will be saved for the next 14 months
Note: It will take 24 hours for these changes to come into effect.
Once you’ve successfully configured GA4 for data retention, you can make the most of your data and use it for the following:
- To understand customer behaviour
- To create customer segments
- To inform your marketing strategies
There you have it, a simple guide on how to retain your data using GA4. For more information on GA4 and how to improve your SEO, please visit the Click Intelligence YouTube channel!
GA4 Search Bar & Analytics
Are you looking to find data information quickly in Google Analytics 4 (GA4) tools? In this guide, we’ll show you some quick tips for finding the answers to the most commonly asked questions so you don’t have to spend a long time searching for the information.
So, let’s get started!
Search Bar Example: Organic Sessions
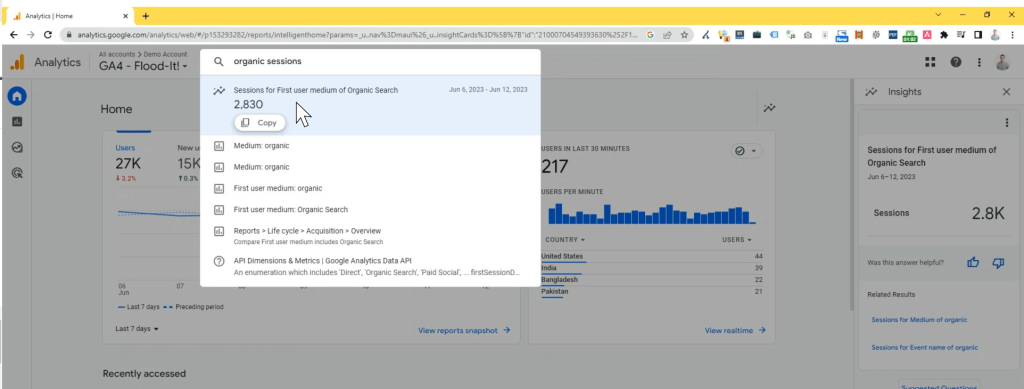
This video guide uses a GA4 demo account. We used the Search Bar to ask GA4 questions and get quick answers.
When searching for ‘organic sessions,’ it displays how many sessions have taken place in the past week as 2,830.
If you want to go further than this, you can ask the search bar for more information. For example, ‘organic sessions since March 2023’ and we’ll see that the sessions that have taken place since then are 28,793.
If you need information quickly, the GA4 Search Bar is an excellent way to do this. If you are in a meeting and someone asks you a data-based question, you can quickly find an answer using this tool. It will make life much easier as you can quickly find answers to the most useful questions!
Insights
To access Insights, select the graph symbol to open the sidebar. Here, you will find various insights that GA4 will ask you whether you find them helpful or not. Our example showed the ‘Sessions for first user medium of Organic Search,’ which we rated as being helpful. This will help Google understand how we are interacting with GA4.
Suggested Questions
If you select ‘Suggested Questions’ at the bottom of the Insights sidebar, then you can see lots of suggestions to ask GA4 based on the following areas:
- Basic Performance
- Demographics
- User Acquisition
- Traffic Analysis
Under each tab, there will be commonly asked questions that you can click on and get a quick answer to. If you’re stuck looking for an answer to a question, check out suggested questions for inspiration. The questions listed are commonly asked by marketers in meetings. If you’re struggling to find information, check out the Insights tab and the Search Bar.
For more information on GA4 and how to improve your SEO, subscribe to the Click Intelligence YouTube Channel.
Understanding Traffic Acquisition: GA4
Google Analytics 4, also known as GA4, is a powerful tool that can help you to understand your website and app traffic better and can help you make informed decisions about your marketing strategies.
But how do you know exactly where your user traffic is coming from? Only by doing so can you can gain a better understanding of traffic-related data.
Luckily, you will learn what sources generate more conversions for your business using the ‘Traffic Acquisition’ reports section in GA4.
Top Tip: You can use the GA4 Demo Account to explore these features.
GA4 Step-By-Step:
Using GA4 for exploring your user traffic may sound complicated, but below we explore the steps you need to take to discover your user traffic.
First Steps: Overview of Acquisition Pages (00:51)
- Log into your Google Analytics 4 property
- You will find ‘Reports’ and ‘Acquisition’ on the left-hand side of the homepage screen. Click on “Reports” and then “Acquisition.”
- The “Acquisition” overview section provides specific information, such as the number of users and top-performing traffic sources.
- Next, in the “Acquisition” dropdown, click on “Traffic Acquisition.”
- From “Traffic Acquisition,” you can start analysing each individual session.
- Analysing each session will help you start to gain an understanding of where your website and app visitors are coming from. It will also inform you what campaigns perform best and drive the most conversions.
- On the “Traffic Acquisition” page, you might notice that this is similar to what you are used to seeing in Universal Analytics.
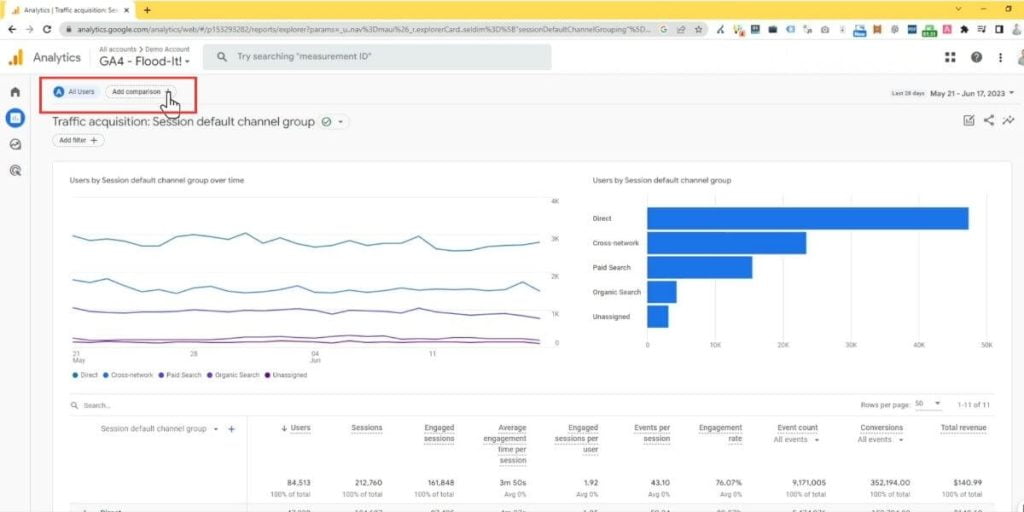
Traffic Acquisition (03:47)
- Open the “Traffic Acquisition” page. You will find 2 graphs, both showing “Session Default Channel Group Over Time.”
- The left-hand side shows a detailed version, and the right a streamlined version. What’s more, when you hover over the graphs, it will display detailed information about that specific section.
Accessing the Traffic Acquisition Page
On the “Traffic Acquisition” page, a ‘Build’ panel will appear on the right-hand side. This is where you can choose your Dimension and Dimension Values. There is a range of dimensions to choose from that include:
- Custom
- Demographics
- Page/screen
- Platform/device, to name a few.
After you’ve chosen your dimension and dimension value, you can apply that to filter your report.
To refresh this, simply click the ‘x’ where the filter was applied, and this will take you back to “Session Default Channel Group.”
Scroll down, and you’ll see that the dimensions start with session-based data, with the default setting “Session Default Channel Grouping.” This differs from “User Acquisition,” which looks at ‘First user source/mediums.’
The Filters:
The report will include ‘All Users.’ However, you can apply filters if you want to look at a subset of users. To do this, click “Add Filter” with the plus arrow.
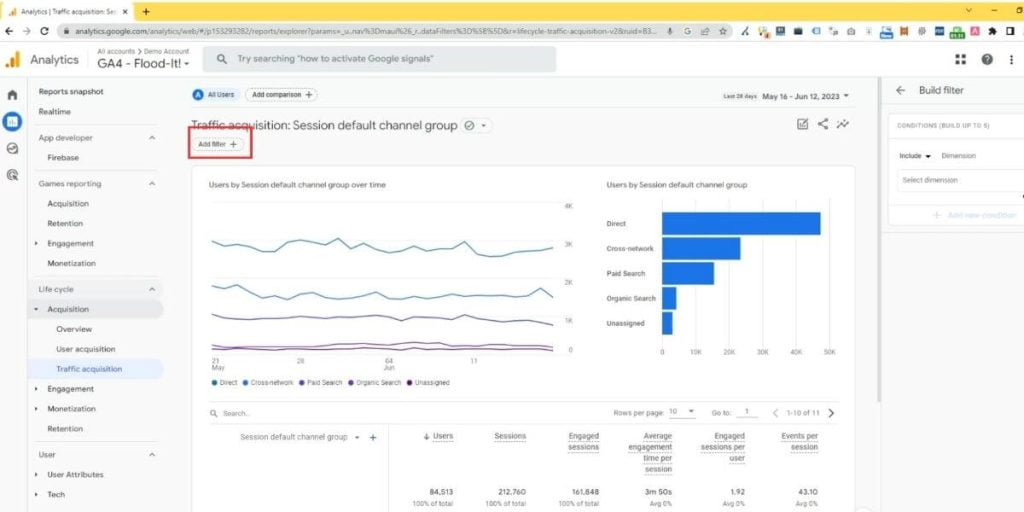
Top Tip: The “Traffic Acquisition” report shows you exactly where your new and returning users come from. Whereas the “User Acquisition” report will only show you where your new users are coming from using browser cookies.
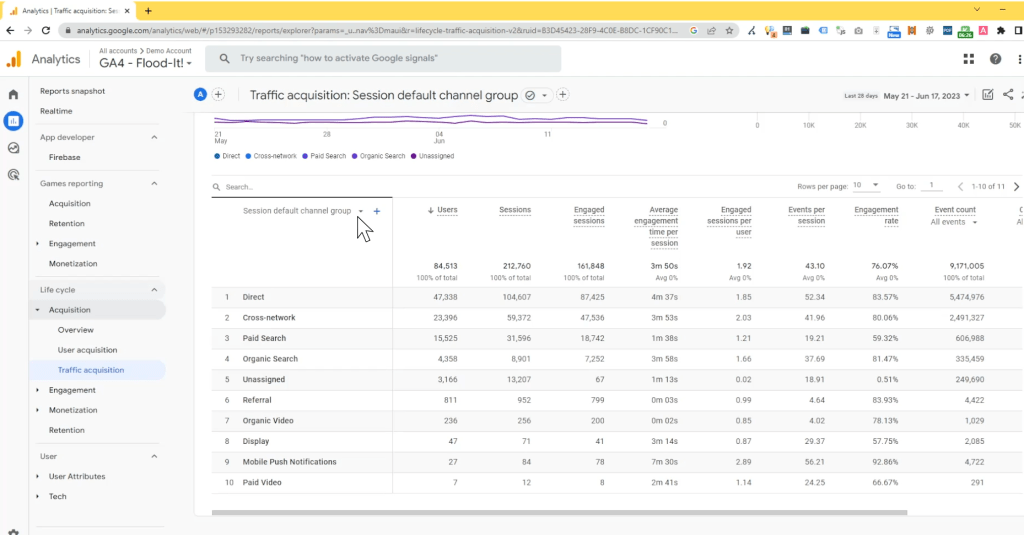
Session-Based Data Breakdown (07:50)
In “Traffic Acquisition,” you will see a breakdown of session-based data, including user numbers, engagement metrics, events per session, and conversions.
For easier viewing of this table, click on the arrow at the bottom of the page to reduce the sidebar and zoom out your browser, as, ideally, you need to view the entire table at once.
You can change the primary dimension from the selection shown by clicking on the dropdown below the search bar. Or, you can add a secondary dimension by clicking on the plus action next to it. Simply click on any dimension to see sources, mediums, or campaigns.
Under the ‘Users’ section, you can see how many users have engaged with your website from each traffic source. When a user visits your website from a new traffic source, another session will be created.
From here, you can go to the left-hand side and see how many sessions were engaged, the conversions, and total revenue. It’s important to note that not all of these metrics are populated automatically.
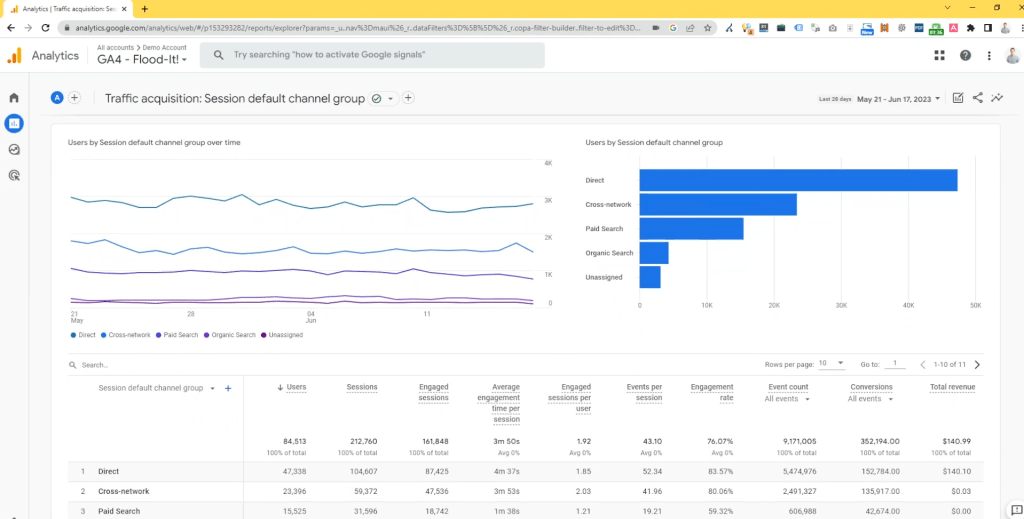
The Metrics
The metrics populated automatically:
- Average engagement time per session
- Engaged Sessions
- Engaged Sessions per user
- Engagement Rate
- Event Count
- Events per Session
- Sessions
- Finally, Users
The metrics that need to be populated:
- Conversions
- Total Revenue
Under ‘Event Count’ and ‘Conversions,’ click the ‘All Events’ dropdown to condense the data. The dropdowns will be determined by what has been previously set up.
Session Source/Medium (12:17)
Let’s quickly look at ‘Session source/medium’; this will tell you exactly where your traffic is coming from and is a more traditional view.
Some different values may appear on your traffic sources. For example, “Not Set” is another form of direct traffic. “None” means the keyword dimension is not filled out for referral or direct traffic.
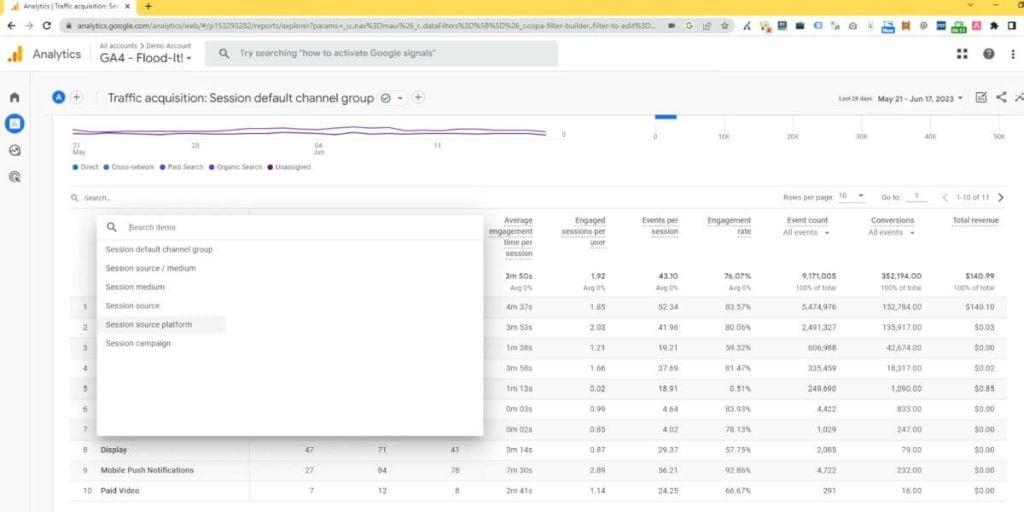
Session Campaign
Let’s explore ‘Session Campaign.’ This section is especially useful for determining a campaign’s success, which performed best, and what drove the most conversions.
If you want to view ‘Session source/medium’ alongside ‘Session Campaign,’ all you need to do is change the primary dimension to ‘Session source/medium.’
Next, click on the plus icon to add a secondary dimension, click on ‘Traffic Source’ and then scroll down and select ‘Session campaign.’
Here, you can see all the campaigns and how they have performed. To focus on specific conversion events, like purchases, click on the dropdown ‘All events’ in the table and select ‘Purchases.’
If you want to look more into the specifics, use the search bar and type in what you’re looking for; for example, ‘Email.’ Doing so will bring up all sources that match that keyword, so you can easily find your email campaigns.
Comparisons (13:33)
To save time creating each report from scratch, you can replicate your ‘Traffic Acquisition report’ in ‘Explorations’ by clicking on ‘Edit Comparisons’ at the top of the page.
An ‘Edit Comparison’ sidebar will appear on the right-hand side of the screen. Click ‘Explore’ at the bottom, and this will create your report into a ‘Free Form Exploration.’
There is much to explore and customise with the “Traffic Acquisition Report” based on your business and campaign needs.
Here are the benefits of using this report:
- Track user sources: See where users come from to measure campaign effectiveness and return on investment (ROI).
- Ensure diversity: Maintain a diverse traffic profile by identifying areas with low traffic.
- Improve content: Identify issues with landing page content and optimise keywords for better user acquisition.
- Identify weak areas: Pinpoint underperforming marketing efforts for targeted improvements.
- Evaluate targeted campaigns: Assess the success of campaigns targeting specific demographics.
By making the most out of this report, you’ll gain valuable insights and opportunities by staying on top of emerging trends and pinpointing areas for improvement by monitoring your traffic with the GA4.